On the web
Fold a Julia fractal until the math finally makes sense
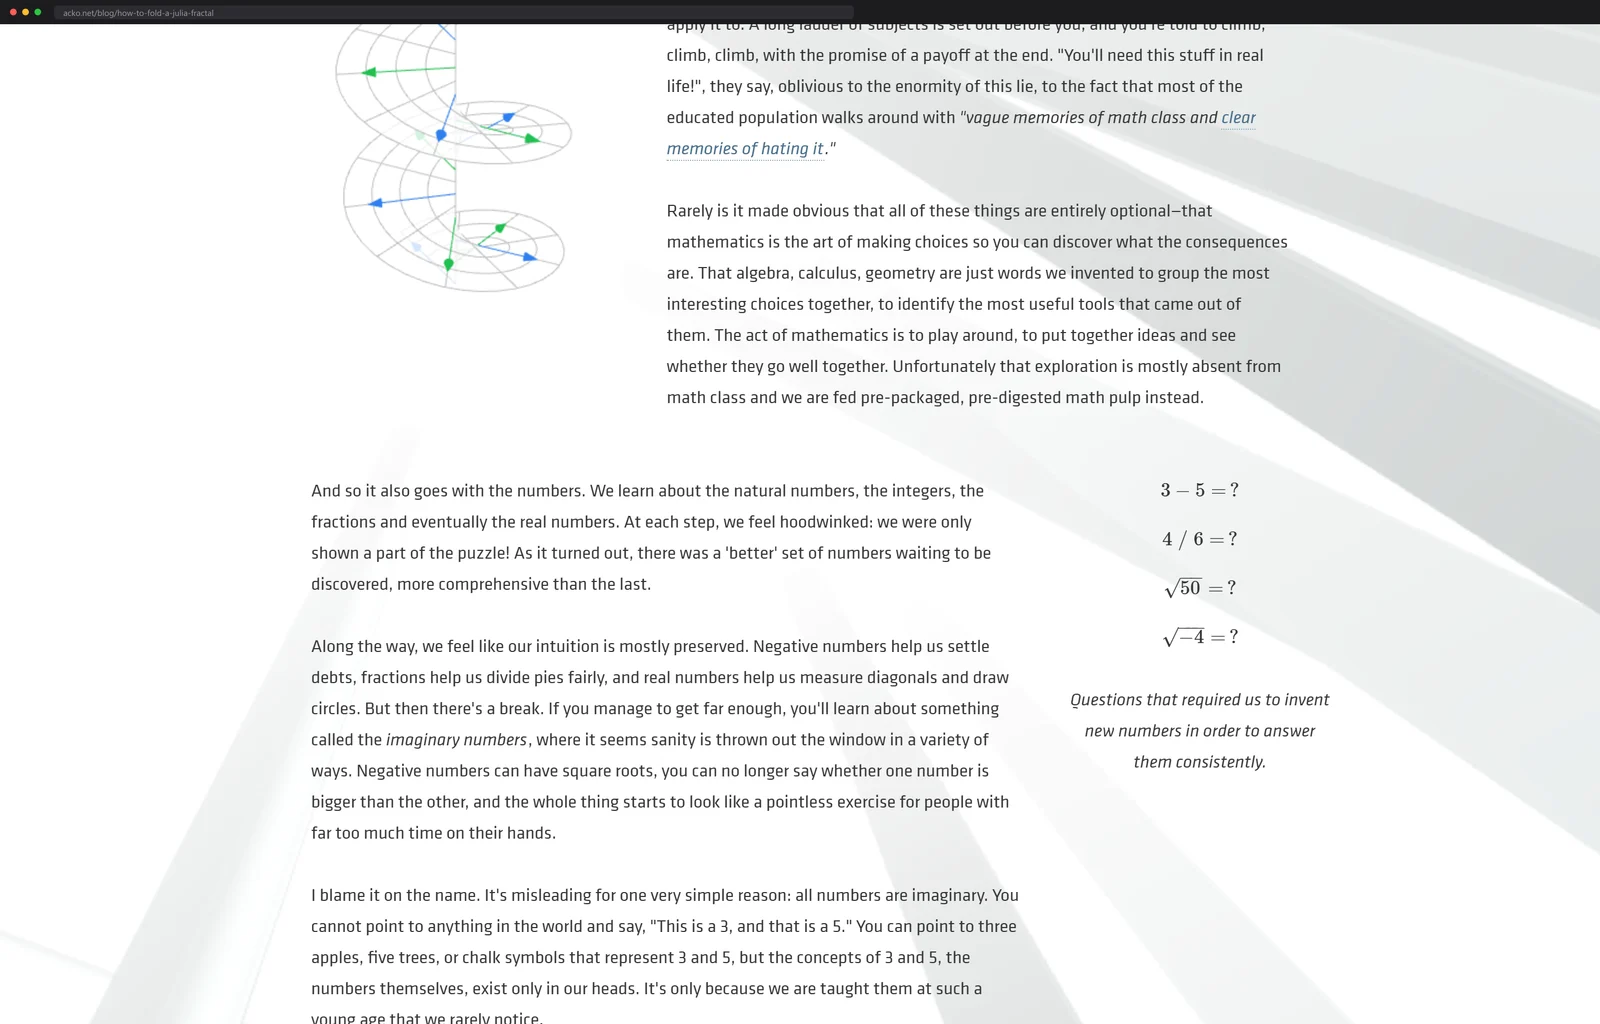
Steven Wittens' essay How to Fold a Julia Fractal builds the Mandelbrot set from scratch with live WebGL diagrams, rendered by his MathBox library on top of Three.js.
Multiplying two complex numbers is really rotating and stretching. Say that in a math class and eyes glaze. Show it as a grid that visibly twists when you multiply, and the fractal at the end stops being magic.
How to Fold a Julia Fractal, by Steven Wittens, is an essay that builds the Mandelbrot and Julia sets from the ground up, and every step is a live WebGL diagram rather than a static picture. The numbers rotate, the grid folds, the famous shape assembles itself out of an operation you can now feel. Wittens published it on January 5, 2013, and the diagrams still run, thirteen years of browser churn later, which for WebGL content is its own small miracle.
The essay does not stop at the pretty shape, either. It walks from what a complex number even is, through the repeated fold-and-stretch that generates the fractal, out to why the same arithmetic underpins waves and quantum mechanics. The footer credits the whole show in four words: diagrams powered by MathBox.
Born on a conference stage
The essay was not the first outing for any of this. MathBox was built for a talk, Making Things With Maths, which Wittens gave at Full Frontal 2012 and again at Web Directions Code 2013, and the slide deck is still online, still running, because the deck itself is WebGL. Not slides with embedded videos of graphs: the graphs are live, computed in front of the audience, covering Bezier curves, procedural generation, physics engines and what he calls hybrid fractals.
So the project is really a triptych. A rendering library, a stage show, and an essay, all drawing from the same toolbox, all built by one person who decided that the correct way to present mathematics is to run it.
And people showed up for it. Wittens later wrote that the Julia fractal essay pulled in 340,000 visits, a number he reported himself while noting it managed that without working on mobile at all at the time. A third of a million people came to watch complex multiplication fold a grid. I find that genuinely hopeful.
The library that draws the math
MathBox is a library Wittens built for exactly this job: presentation-grade mathematical graphics in the browser. It sits on Three.js, the standard WebGL toolkit, with his ShaderGraph compiler assembling the GPU programs underneath. It is MIT-licensed and sits around 1,500 GitHub stars.
What separates it from raw Three.js is that it is declarative. The quick start reduces every scene to four decisions: a camera, a coordinate system, some data, and a shape to draw the data as. Wittens declares a cartesian grid, an interval of sample points, a curve. When the essay needs the grid to fold, he declares the folded state and the library animates the transition between the two.
The library got a second life, too. In September 2015 Wittens published MathBox 2, a ground-up rewrite, after concluding the original had become diagrams of diagrams, hard to compose and slow as scenes grew. The rewrite turned it into a reactive pipeline: data flows through as arrays of up to four dimensions, width, height, depth and a tuple per point, and operators like transpose, repeat and interpolate reshape the stream before the GPU draws it. He describes the result as a strange vector GPU driver, which is accurate and also undersells how pleasant it is to use.
Underneath both versions sits his ShaderGraph compiler, snapping GPU program fragments together like plumbing. If you have never felt what a shader actually is, there is a playground sighting where you type one and watch it light, and it is the fastest route I know to the intuition.
So the essay is not illustrated with renders of math. It is illustrated with the math itself, running, which is why you can watch the transformation instead of trusting a caption.
It helps to say what the crank actually turns. The whole fractal comes from one tiny rule, take a complex number, square it, add a constant, and feed the answer back in. Squaring a complex number doubles its angle and squares its distance from zero, which on screen is exactly that twist-and-stretch of the grid, applied over and over. Points that stay caught in the fold forever are the set; points that fling off to infinity are the void around it. Wittens earns the famous picture by making you watch each fold land, so by the time the Julia set appears it feels less like magic and more like taffy.
The wider lesson is about what the web is for. A printed page can show you the Mandelbrot set. Only a page that computes can show you the folding motion that produces it, one frame at a time, keyed to the sentence explaining it.
The company this essay keeps
There is a name for the genre, explorable explanations, and a whole trailhead town at explorabl.es: an open-source, loosely curated collection run by artists, coders and educators, sorted by subject, with tools for making your own. It is the single best afternoon-loser I know of in this category, and everything on it shares the fractal essay's DNA.
The sibling I send people to most is Ben Eater's Visualizing quaternions, built with Grant Sanderson of 3Blue1Brown. It presents videos where the diagram on screen is the video: pause the narration, grab the 4D rotation mid-sentence, and drag it yourself, then let the lecture resume from your hands. Quaternions are the rotation math inside every game engine and spacecraft, and this is the only presentation of them that has ever stuck for me.
What strikes me, clicking between all of these, is how little the 2013 essay has aged against its descendants. The genre got a name, a hub, and famous practitioners, and the founding document still runs in the same tab with no apology. Thirteen years on, Wittens' bet looks settled. The way to teach an operation is to let the student turn its crank, and the browser is the only medium where the crank costs nothing to ship.
Fold one yourself
mathbox.org carries dozens of live examples, field lines to a full solar system, each one linking straight to its source. And the quick start above is shorter than it sounds: it walks you from an empty HTML file to an animated sine wave with a handful of declared primitives, camera, axes, grid, curve, play. The distance between reading this essay and drawing your own moving math is one free afternoon.
More math and machinery you learn by moving it: a mechanical watch you disassemble in the browser, and a circuit that re-solves itself while you watch.
Next up
In defense of the one-more-minute machine