Play
One line of code, 256 dots, and a whole animation
tixy.land animates a 16 by 16 grid of dots from a single JavaScript expression. The sign of the number picks the color, the size sets the radius. That is the whole thing.
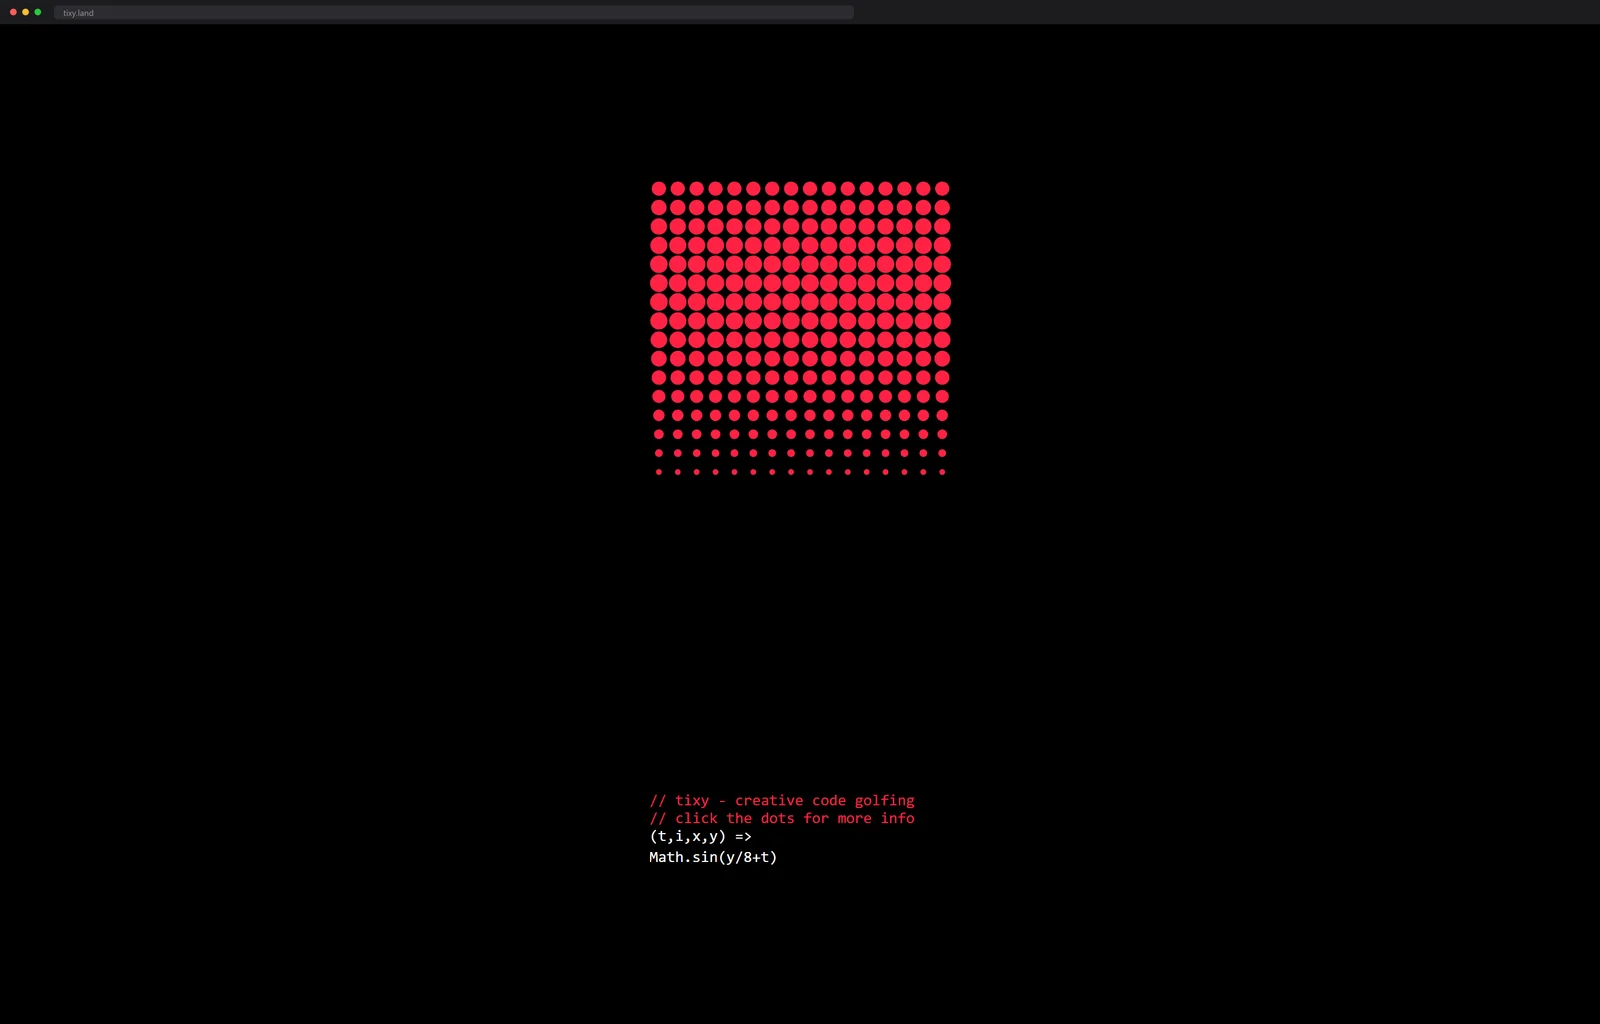
A grid of red dots breathes in a slow diagonal wave. Underneath it, the
entire program that makes the wave: Math.sin(y/8+t). That is not a
snippet of the code. That is the code.
tixy.land, which Martin Kleppe put up in
November 2020,
gives you one function, (t,i,x,y), and a grid of sixteen by sixteen
dots, and nothing else. You have thirty-two characters to type an
expression, and it runs that expression once for every one of the two
hundred and fifty-six dots, every frame. The parameters are the whole
vocabulary: t is seconds since load, i is the dot's index from 0 to
255, x and y are its column and row.
The rule that turns arithmetic into a picture is beautifully small. Your
expression returns a number. If the number is positive the dot is one
color, if negative another. The size of the number, from zero to one,
sets how big the dot is. Any term with t in it makes the whole thing
move. So Math.sin(y/8+t) says the brightness of each row follows a
sine wave that shifts with time, and out rolls the diagonal you are
looking at.
I read the source, all eight kilobytes of it
For once you can read every line of a sighting's engine. The entire
page, markup, styles and renderer together, is 7,968 bytes and loads no
external scripts; I measured. Inside is a single loop over the dots on
a plain 2D canvas: evaluate your function, cap the result at one, draw
an arc with the radius it earns. A negative result flips the fill from
white to red, hex #F24, and that is the entire color system. The
site's built-in tutorial states the rule in seven words: positive
numbers are white, negatives are red.
For calibration, the screenshot of tixy at the top of this page is a 37-kilobyte webp. The picture of the thing costs nearly five times more than the thing.
The two-color rule does more design work than it looks like it should. Because the only palette move is positive white against negative red, every memorable tixy is really a drawing of where a function crosses zero, animated. Sine waves cross politely and you get ripples. Tangent crosses violently and you get strobing chaos. The site is secretly a zero-crossing visualizer wearing a toy's clothes.
A progression that teaches the whole system in five entries:
y-7.5 splits the grid into two color fields, x/16 fades dot
sizes across a row, Math.sin(t) pulses all 256 dots together,
Math.sin(x/2+t) sends the pulse traveling, and from there you
are one multiplication away from the patterns on the gallery
wall.
The constraint is the design. Because the input caps at 32 characters, every animation on the site is also its own source code, short enough to memorize, and the code travels inside the share URL. People answered with ports in other languages and on other hardware, including a version that drives a real 16 by 16 LED matrix from a Raspberry Pi Zero. An expression you golf in a browser tab can run on a bedroom wall.
The hardware port is the purest compliment the design could
receive. Because the whole contract is one function returning
one number per dot, reimplementing tixy anywhere takes an
afternoon: 256 LEDs, the same (t,i,x,y) signature, done. Very
few web toys survive being unplugged from the web.
The shader idea, shrunk until it fits in your head
That is the teaching trick. Once you see that a single formula
evaluated per cell is exactly how a shader colors pixels, you
understand the idea behind every fragment shader on this site, on a
canvas small enough to read. When you want the full-size version of
that idea, The Book of Shaders starts
at this exact doorstep and walks you into real GLSL, one formula at a
time. The tixy source itself is
on GitHub when you want to see how
little machinery the magic needs: 262 stars, a functions/
directory, and a formulas.txt of collected expressions that reads
like a hymnbook for a very small church.
The maker collects tiny alphabets
tixy is Martin Kleppe being gentle with you. Under his handle
aemkei he also maintains
JSFuck, the long-running
proof that any JavaScript program, any at all, can be rewritten
using exactly six characters: []()!+. The repo has 8.6
thousand stars and a README that patiently derives the entire
language from those six keys. Against that, a 32-character
budget with four named variables is practically a country
estate.
Seen from here, tixy looks less like a toy and more like one entry in a lifelong catalog of shrunken alphabets. Pick a vocabulary small enough to hold in one hand, then show how much of the world it still spells.
When 32 characters starts feeling roomy, the next arena up is the 140-character demoscene over at Dwitter, where the canvas grows to 1920 by 1080 and the budget is a little over four times tixy's.
Type tan(x*y*t) and hold on.
More math turned straight into motion: a GPU solving fluid dynamics you smear with the mouse.
Next up
The blog where every diagram is a React toy you can grab